
Platform / Dashboard
Revenue collected, businesses licensed, compliance gaps, enforcement activity. Everything your team needs to act on, updated in real time and built around how you actually work.
Key Benefits
Built for the numbers that matter.
Three outcomes,
always on screen
Track revenue in real time
See year-to-date collections alongside potential revenue still on the table, so your team always knows what's been recovered and what's left.
Spot problems before they escalate
Fraud flags, chronic offenders, and contested licenses surface automatically. No manual digging through records.
Report with confidence
Compliance trends, enforcement activity, and business churn data are always current and ready to share with leadership or council.
Revenue & Compliance
Know exactly where you stand.
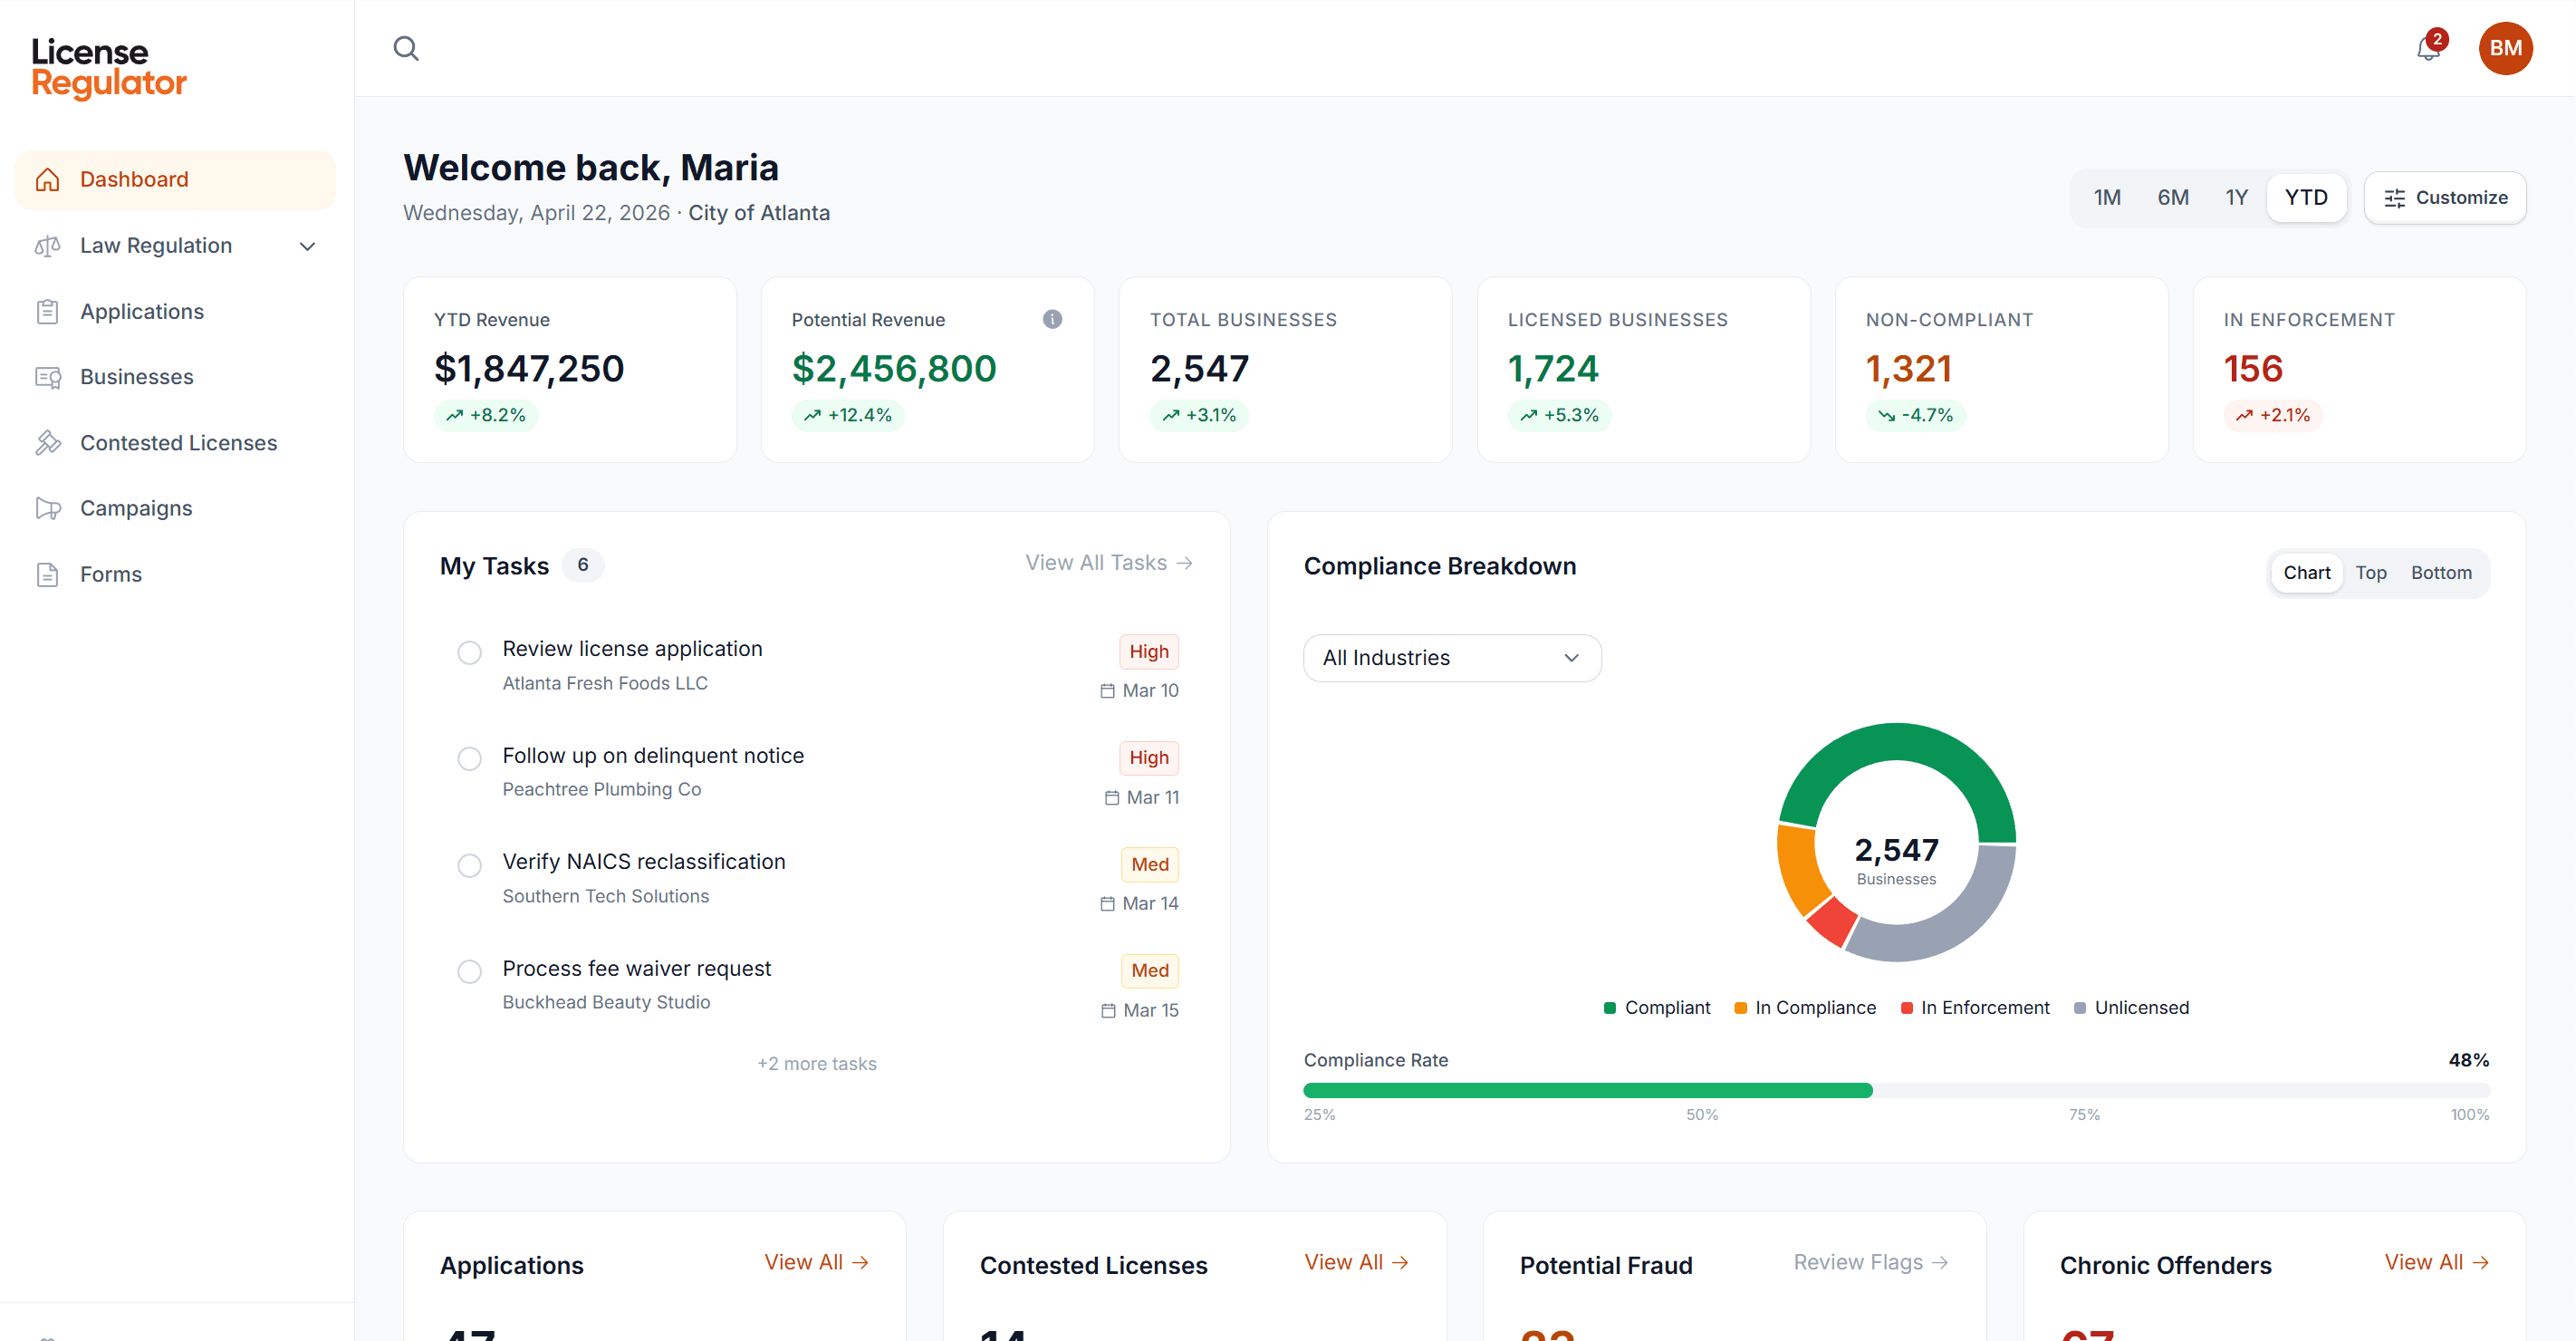
The dashboard opens with the numbers leadership cares about most: year-to-date revenue, potential revenue still uncollected, total business count, and a real-time compliance rate. Every metric includes trend indicators so you can see whether things are improving or need attention. Filter by time period to compare month-over-month, quarter-over-quarter, or year-to-date.
- YTD revenue with potential still on the table
- Real-time compliance rate across every industry
- Trend deltas on every KPI, updated hourly
Jurisdiction Snapshot
City of Atlanta · Year to Date
YTD Revenue
+12.4%$8.4M
Potential Revenue
-8.2%$2.1M
Businesses
+4.1%12,480
Compliance Rate
+6.3%87%
vs. Prior Year
Updated 3 min ago
Monitoring Queue
42 items · 2 flagged for review
Heritage Cafe
New Application
Ace Plumbing Co.
Renewal·Potential Fraud
Downtown Salon
Transfer
Midtown Market
Unlicensed·Chronic Offender
Blue Line Taxi
New Application
Oak Grove Daycare
Renewal
Enforcement Intelligence
See who needs attention, and why.
The Monitoring Queue shows every item waiting for review — new applications, contested licenses, flagged businesses — each with status, wait time, and assignment. Potential Fraud surfaces repeated ownership or name changes at the same address. Chronic Offenders flags businesses unlicensed for two or more consecutive cycles. These aren't reports you have to run. They're always visible.
- Monitoring Queue with wait-time and assignment
- Potential Fraud pattern detection
- Chronic Offender surfacing across cycles
Trends & Activity
Measure what's working over time.
Track compliance rates month by month to see whether enforcement campaigns are moving the needle. The Business Churn chart shows new businesses opening versus those closing. Enforcement and Legal Activity break down which industries are generating the most cases, so you can allocate resources where they'll have the most impact.
- Compliance trend, month-over-month
- Business churn: opened vs. closed
- Enforcement and legal activity by industry
Trends & Activity
Last 12 Months
Compliance Rate
87%
Business Churn
+45 net / 6mo
Customize Dashboard
Drag to reorder · Toggle to show/hide
Revenue
KPI
Queue
Table
Trends
Chart
Section visibility
Customizable Layout
Your dashboard, your way.
Not every role needs the same view. The Customize Dashboard panel lets each user toggle modules on or off, drag sections to reorder, and rearrange items within each group. A Finance Director might lead with revenue and compliance trends. A licensing officer might prioritize the Monitoring Queue and active campaigns. Everyone gets the layout that matches how they work, with a one-click reset to defaults.
- Drag-to-reorder modules, per user
- Toggle on/off at the section level
- One-click reset to agency defaults
By Role
Built for every role in your agency.
The numbers you need for council meetings.
Revenue, compliance rates, and trend data are always current. Export or screenshot what you need without waiting on a report.
Your daily workload, prioritized.
The Monitoring Queue and task list show exactly what needs review, how long it's been waiting, and who's assigned.
A clear picture of your business community.
Total businesses, compliance breakdown by industry, and churn data help you understand your economic base at a glance.
See it with your data
See your jurisdiction's dashboard.
We'll set up a demo with your city's data and walk you through every module. No commitment, no RFP required.